Twenty days of measurements, 38 sensors, 9.5% anomalies
The dataset is the Server Machine Dataset released with OmniAnomaly (MIT licence): 38 server metrics sampled every minute for twenty days, a training part with no incident and a test part labelled point by point — 28,479 points, 9.5% of them anomalous, spread over a dozen episodes.
I compare four detectors: a convolutional autoencoder (27,094 parameters, trained in six seconds on 64-minute windows, using reconstruction error as the score); the deviation from a 32-minute moving average; the deviation from the previous point; and a random score, which looks at nothing at all and serves as a control.
The same detector, two very different marks
Almost every paper in the field evaluates with point adjustment: if a single point of an anomalous episode is detected, the whole episode counts as detected. The intent is defensible — catching a failure to the minute hardly matters. The effect is devastating: one lucky point inside a long episode is enough to claim all the credit. Kim and colleagues showed this in 2022; I measured it again here.
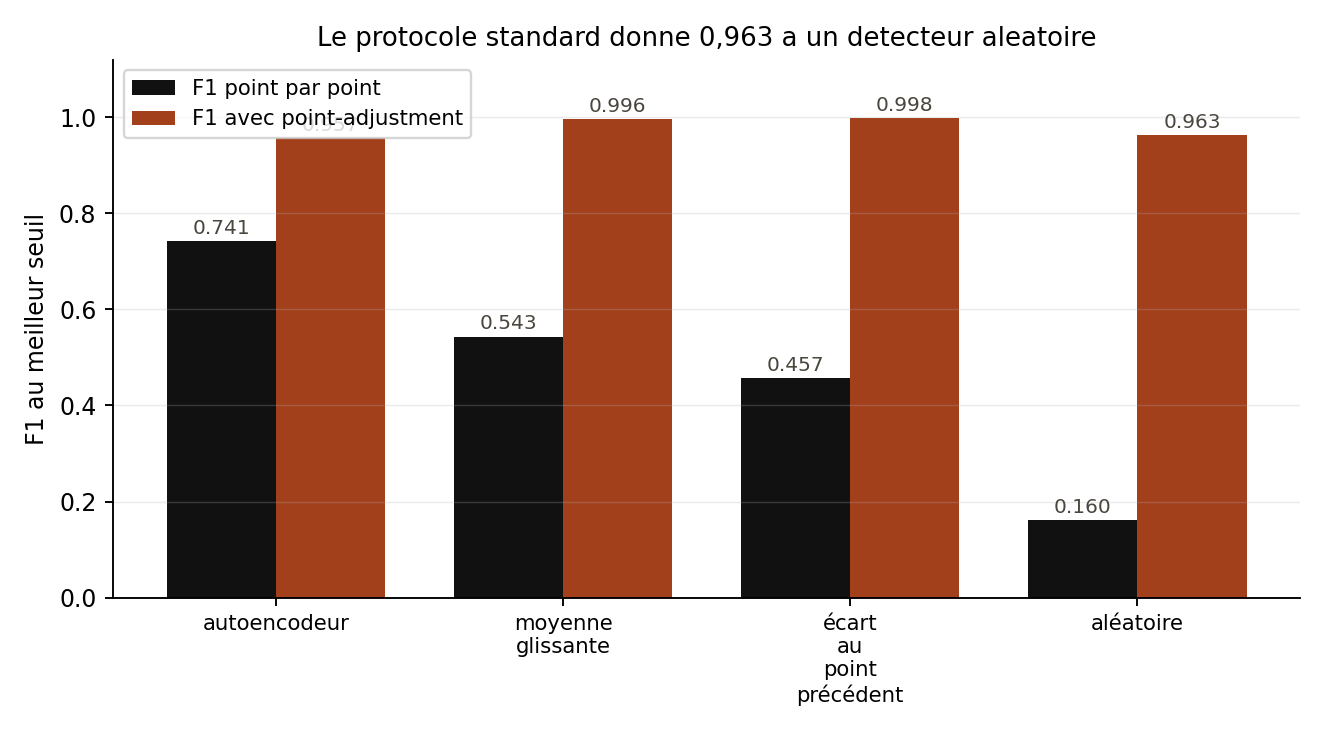
| Method | F1 point by point | F1 with point adjustment | PR area |
|---|---|---|---|
| convolutional autoencoder | 0,741 | 0,957 | 0,653 |
| deviation from moving average | 0,543 | 0,996 | 0,531 |
| deviation from previous point | 0,457 | 0,998 | 0,467 |
| random score | 0,160 | 0,963 | 0,094 |
Under the standard protocol the four methods hand in the same paper: between 0.957 and 0.998. The random score reaches 0.963, better than the autoencoder. Published as is, this table would suggest an excellent detector.
03 · What honest measurement showsThe learned model does help — just not where you thought
Point by point, the ranking becomes informative again: the autoencoder reaches 0.741 against 0.543 for the moving average, 0.457 for the previous-point deviation and 0.160 for chance. The area under the precision-recall curve says the same (0.653 against 0.531, 0.467 and 0.094).
So the conclusion is not that learning is useless — quite the opposite: it adds nearly twenty points of F1 over the most serious baseline. But the most widespread protocol cannot show it, since it gives almost the same mark to everyone. Before comparing two models, check that the scale weighs.
04 · The sandbox detectorWhat it does, and what it does not
The model you play with above has seen only one of the 38 metrics, chosen for being readable to the eye (the most regular over twenty-four hours). It reacts to whatever does not look like what it learned, which shows nicely when drawing. But it must be said: on the real dataset, this one-dimensional detector scores an F1 of 0.196, barely above chance (0.160). A single metric does not carry the server's failures; the 38-dimensional model is the one that catches them.
The model running in the page is the one that was trained: the largest gap between the JavaScript port and PyTorch is 7·10⁻⁶ on the reconstruction and 3·10⁻⁷ on the error.